
The Organisation for Economic Co-operation and Development (OECD) found that having a say over the actions of governing bodies increases trust in those bodies by 3.1%. However, less than half of Dutch citizens (39%) believed they were able to contribute to decision-making.
The current status of participation in Dutch municipalities is mixed. For example, in Leiden in South Holland, around 10% of citizens engage in decision-making. However, this tends to skew towards residents from wealthy neighbourhoods.
To increase engagement, the Dutch government has introduced laws, such as:
- Omgevingswet, to involve residents in environmental planning and permitting.
- Wet versterking participatie op decentraal niveau, obliging local government to engage residents in the execution and evaluation of policy.
Whilst citizen participation brings the benefits of a more trusting and constructive relationship between residents and the council, it is important to show whether it is making a real difference to the local area. This article explores how to measure community engagement to generate evidence that your workflows are effective and are improving the lives of your residents.
Key takeaways
- Councils should define success before each engagement project by setting clear measures for reach, participation, representativeness, decision influence and whether residents felt heard.
- Participation figures only show part of the picture, so councils must combine quantitative data with surveys, officer observations and analysis of written feedback.
- A clear audit trail should show what residents said, how decision-makers considered their views and what changed as a result, including an explanation when no changes were made.
- Under the Omgevingswet, councils need reliable evidence of who was involved, how participation took place and how the results influenced plans and decisions.
- Effective measurement requires named ownership, joined-up online and offline data, targeted action to correct under-representation and careful human oversight of any AI-assisted analysis.
How to measure community engagement
Define your measurement framework
Before you commit to a project, set out the framework by which you will measure its success or otherwise afterwards. Knowing what constitutes success will help guide you towards those aspects that provide tangible value to your community.
This is a good guide for gauging impact:
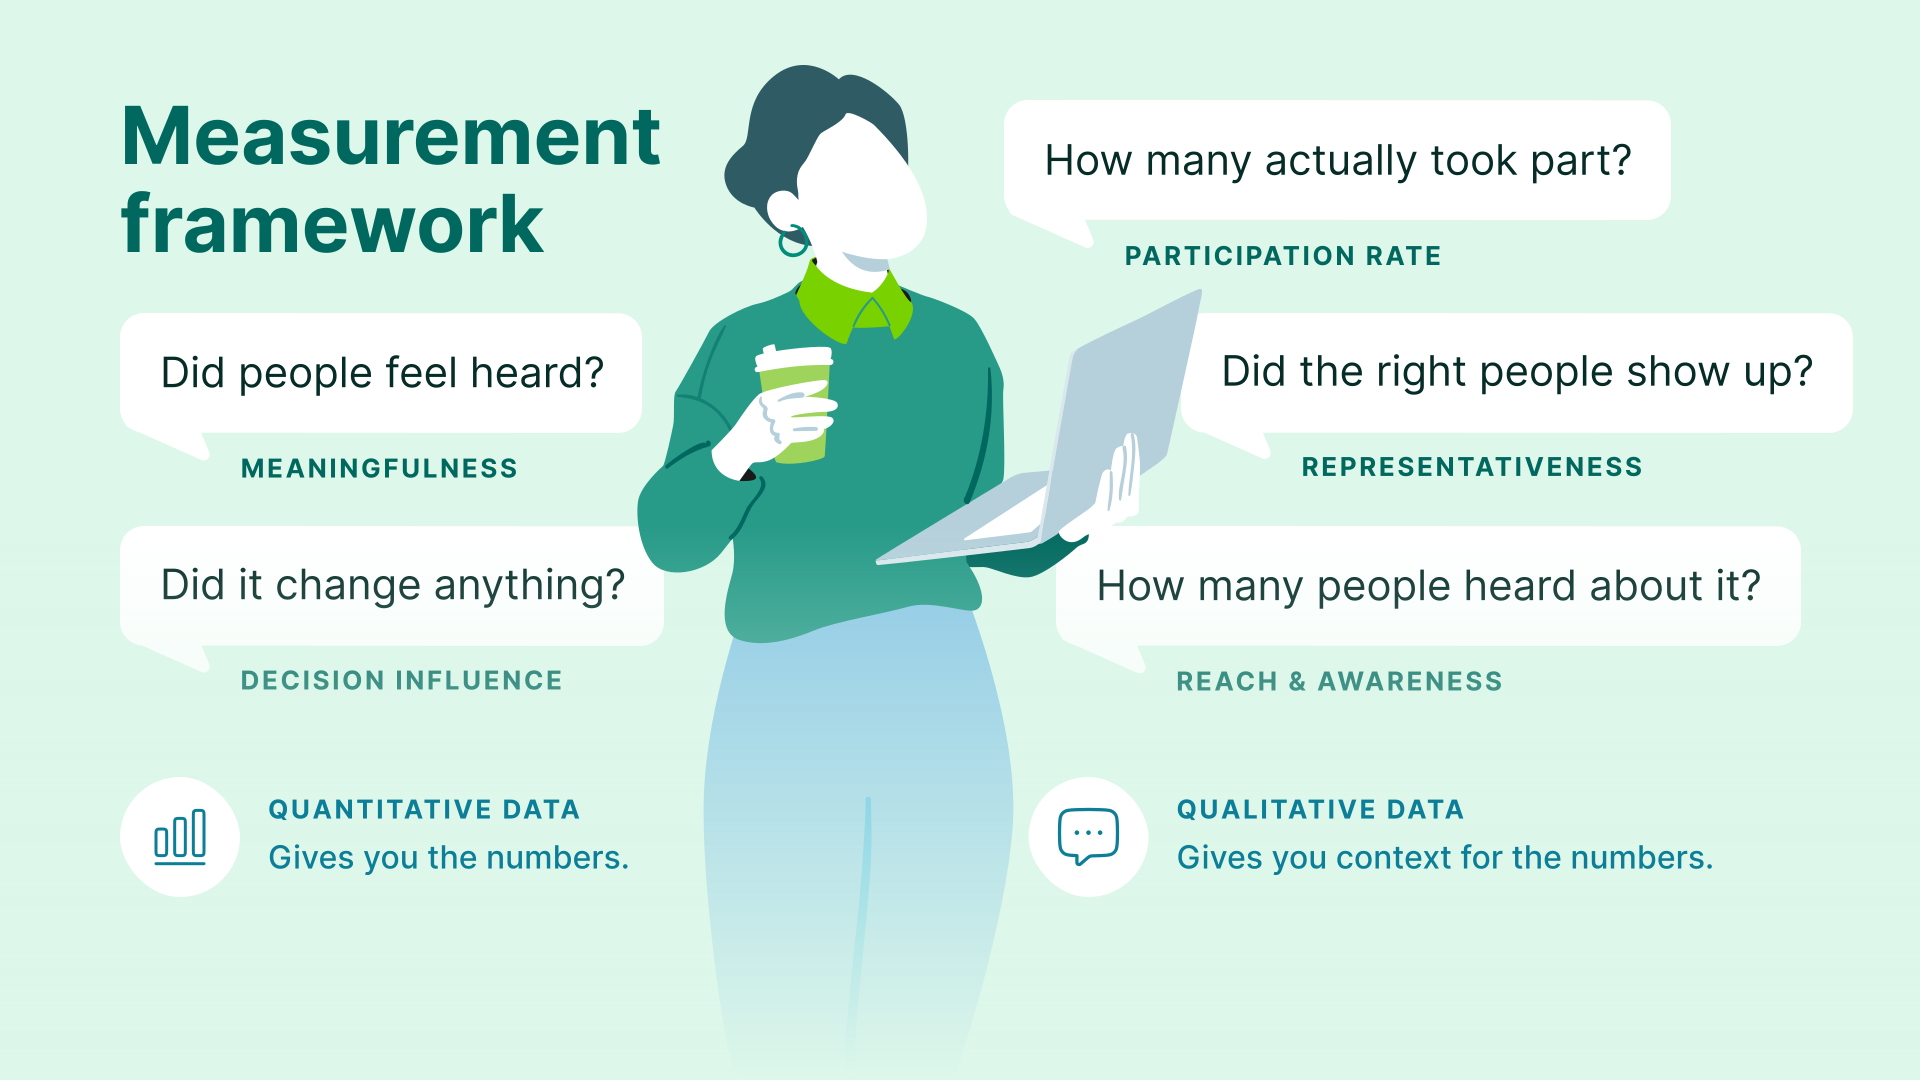
- Reach: how many people encountered the invitation to participate or consumed your information about it, across different communication channels and neighbourhoods.
- Participation rate: how many of those aware of the participation opportunity attended sessions, submitted feedback or otherwise actively participated.
- Representativeness: how closely your cohort of participants reflect the affected population, using government data to assess the demographics of your citizens in terms of age, income or background, for example.
- Decision influence: whether resident input changed the proposal, implementation plan or final decision in a tangible manner and whether the council recorded and reported that effect.
- Perceived meaningfulness: whether participants understood the process and believed their contribution was taken seriously.
This requires collecting both quantitative and qualitative data related to the project.
Quantitative engagement data
This should include how many participants took part, the number of survey responses, attendance at your engagement events and the metrics from your digital platforms, amongst other data points.
Whilst this will tell you how many, it doesn’t tell you how successful the project was in context. Make sure you set a baseline for what constitutes success in your community engagement. Base this on other, similar municipalities’ outreach or the outcomes of your previous engagement attempts. Do this before the consultation begins and keep track of your progress towards these benchmarks.
Qualitative engagement data
Look at outcomes such as what citizens say in post-consultation surveys, the debrief logs written by officers and your analysis of open responses to participation opportunities. This will help you understand why your project was successful or not.
The quantitative data can only tell you the numerical outcomes. You must combine it with qualitative data to truly understand the context around why a project went as it did. It is essential to study this to understand how to improve outreach in the future and provide more value to citizens.
Create an audit trail to measure decision influence
It is important to be able to report accurately on how much influence citizens had over each specific topic. This builds trust and demonstrates that you listen, take note and act on input, rather than run participation sessions as a tick-box exercise.
For every project, document:
- The input provided by community members and groups
- The considerations of council members in regard to this input
- What, if anything, changed about the project as a result of the engagement process.
This is the only way you can demonstrate the impact of community engagement. If nothing changed, be honest. But make sure you have recorded the process behind making that decision and can back it up with credible evidence as to why you did not incorporate citizen input.
KPI reference table
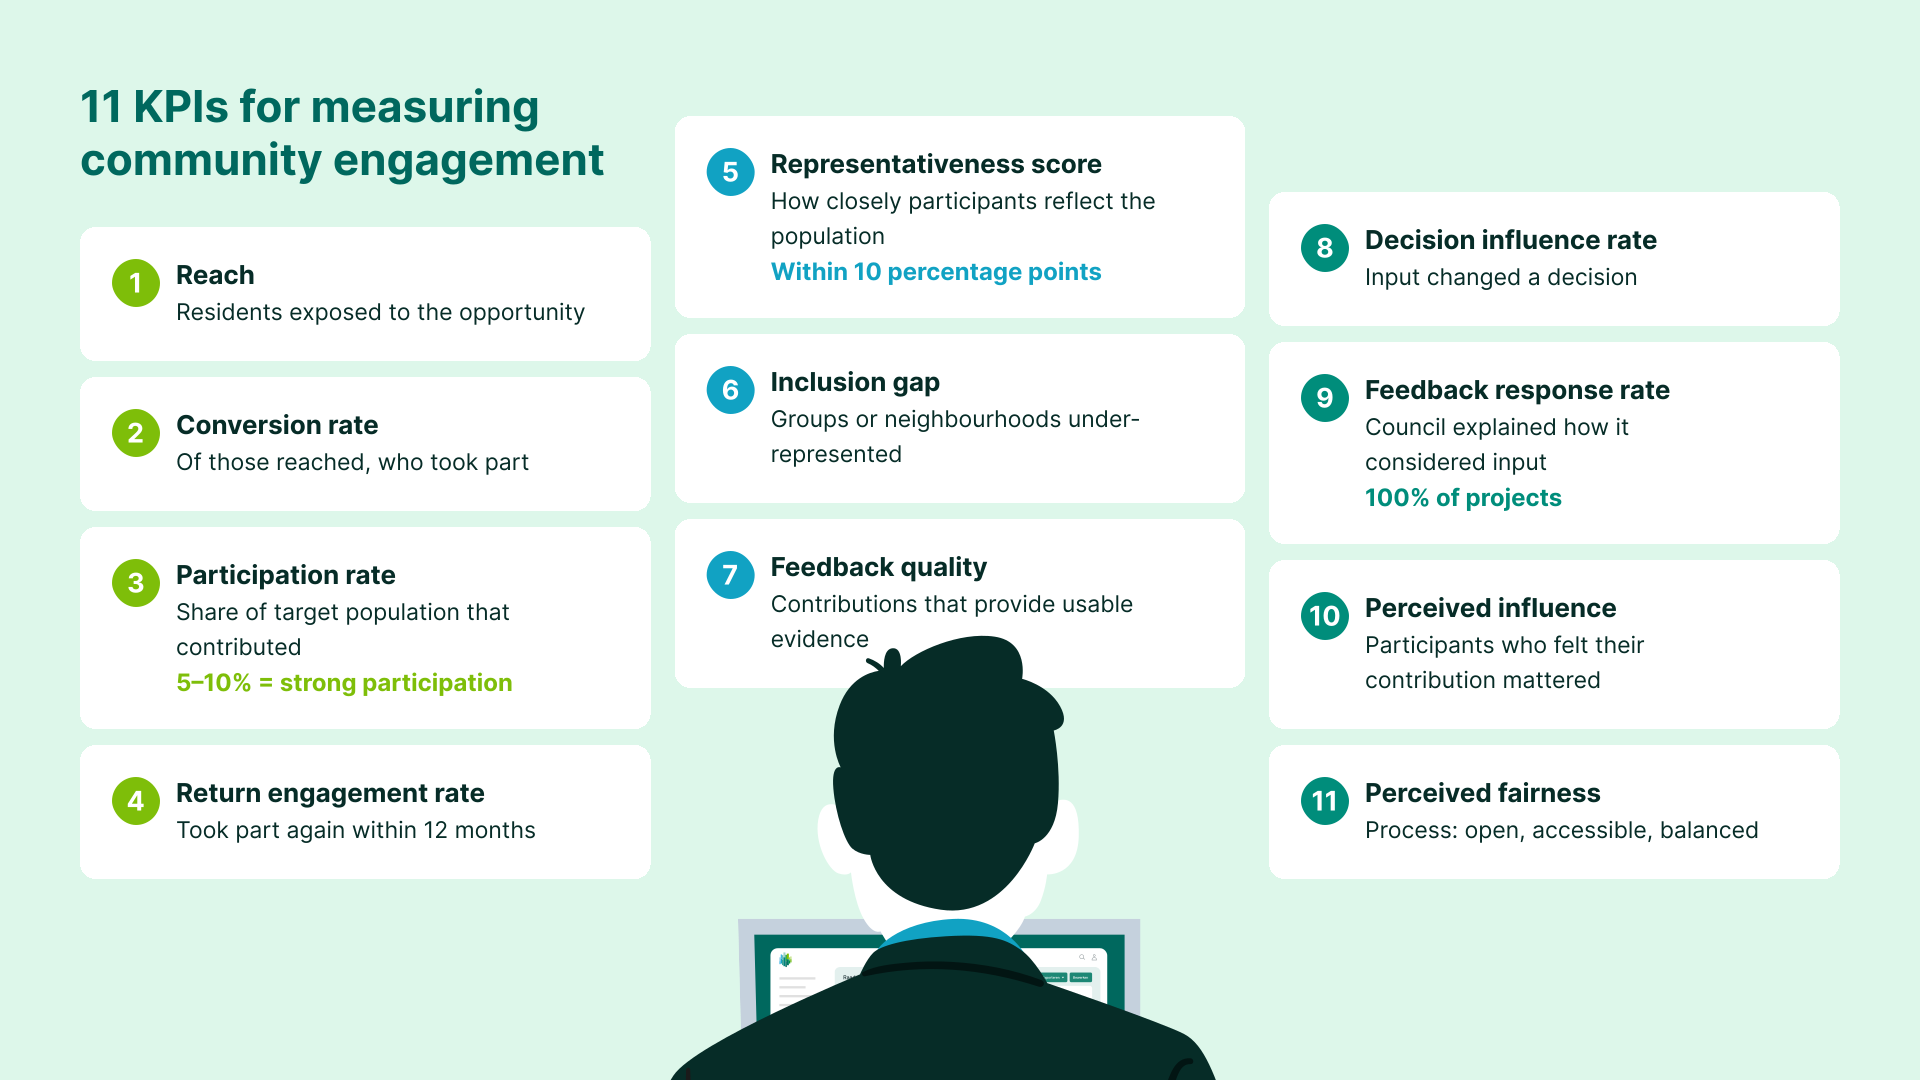
| KPI | What it measures | How to collect | Benchmark or target |
| Reach | The number and proportion of residents exposed to the participation opportunity | Email delivery data, website visits, social media impressions, leaflet distribution and recorded door-knocks | Aim to reach a clear majority of the affected population and track reach by neighbourhood and communication channel. |
| Participation rate | The percentage of the defined target population that actively contributed, attended or responded | Participation platform analytics, event registers and verified response records | Set a local target for each project. Around 5% to 10% may represent strong participation in a broad municipal consultation, while targeted exercises may require a higher rate. |
| Conversion rate | The percentage of people reached who went on to participate actively | Compare reach figures with completed surveys, meeting attendance and submitted contributions | Establish a baseline by channel, then improve conversion in later projects. |
| Representativeness score | How closely participants reflect the affected population across relevant demographic and geographic groups | Compare optional registration or survey data with municipal and neighbourhood statistics. | Keep participation levels within 10 percentage points of the target population for priority groups, where practical. |
| Inclusion gap | Which groups or neighbourhoods are under-represented or absent | Demographic analysis, postcode data and outreach records | Identify all material gaps and take corrective outreach action during the process rather than after it closes. |
| Feedback quality | The proportion of contributions that provide usable evidence, ideas or clearly expressed concerns | Officers assess submissions against a consistent scoring rubric | Set a baseline during the first process and design future projects to set the groundwork for inspiring better-quality input. |
| Decision influence rate | The percentage of participation projects in which public input demonstrably changed a proposal, decision or delivery plan | Decision audit logs, council reports and response to feedback documents | Evidence the effect of participation in every completed project, even where input did not change the final decision. |
| Feedback response rate | Whether the council explained how it considered public input | Review published reports, decision records and participant communications. | 100% of projects should publish a clear response explaining what changed, what did not and why. |
| Perceived influence | The percentage of participants who felt their contribution mattered | Short post-consultation survey | Set a local baseline, then aim for year-on-year improvement. |
| Perceived fairness | Whether participants believed the process was open, accessible and balanced | Post-participation survey and facilitated feedback sessions | Aim for a strong majority of positive responses and investigate material differences between demographic groups. |
| Return engagement rate | The percentage of participants who take part in another council engagement process within 12 months | Participation platform analytics, consent-based CRM records and attendance data | Track annually and seek steady growth without relying only on the same regular participants |
How community engagement measurement connects to the Omgevingswet
The Omgevingswet requires councils to explain how they involved residents, businesses, community organisations and other public bodies in decisions about the physical environment. Councils must also show what they did with the results.
A vague statement that “consultation took place” is not enough. Councils need records showing:
- Who had the opportunity to take part
- Who actually participated
- What issues participants raised
- Whether their input changed the proposal
- How the council explained its final decision
Adapt measurement to the decision
Different Omgevingswet instruments require different approaches.
- A municipality-wide environmental vision may need broad outreach and demographic analysis.
- A neighbourhood plan may focus more closely on affected streets, businesses and local groups.
Councils should use the same basic measures across projects, while adapting them to the scale and audience. These could include:
- Reach and participation rate
- How representative the process was
- Main feedback themes
- Changes made to the proposal
- Whether participants felt heard
Treat permit applications differently
Environmental permit applications follow a different process. Applicants generally state whether they carried out participation and describe the outcome.
For some activities outside the environmental plan, the municipal council may make participation compulsory. Administrators should therefore distinguish between:
- Participation organised by the municipality
- Participation carried out by an applicant
- Participation required by the council
Assign clear responsibility
After adopting Wet versterking participatie op decentraal niveau, the council should set out:
- Who collects participation data
- Who checks its quality
- Where the evidence is stored
- Who reports the findings to the council
Clear ownership improves accountability and prevents information being scattered across inboxes, spreadsheets and separate project files.
Show how participation affected the decision
Council members need more than just attendance and response figures to demonstrate the impact of the process. A useful report might say something like:
“We received 340 responses. Twelve distinct concerns were identified, two neighbourhoods were under-represented and three changes were made to the plan.”
This gives councillors better evidence than simply saying the municipality “consulted widely”.
Separate volume from representativeness
Sensitive subjects such as housing, traffic and reception centres may attract large numbers of responses from highly motivated groups. Those views matter, but they may not reflect the wider population. Councils should report both:
- How much feedback they received
- Who provided it
Combining response numbers with demographic and geographic data gives decision-makers a more accurate picture and reduces the risk that the loudest voices dominate the process.
Best practices for measuring community engagement
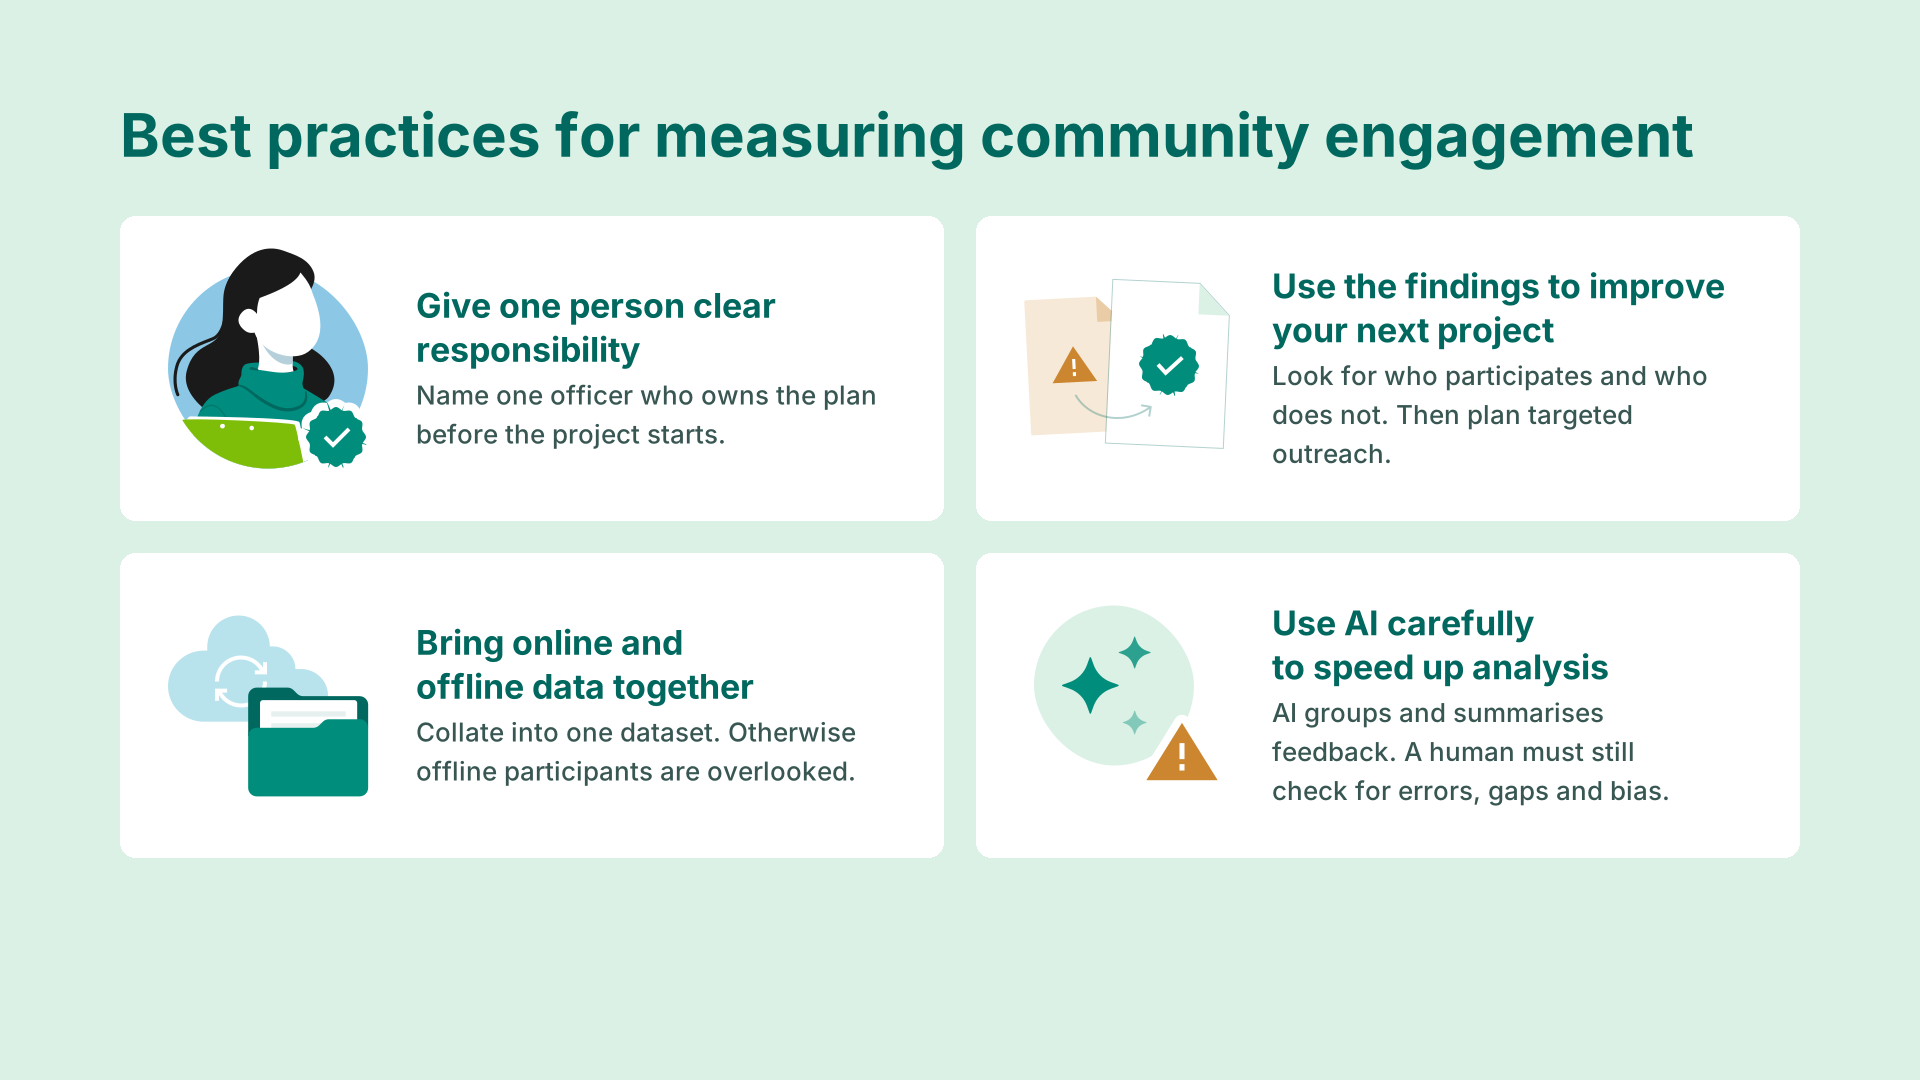
Give one person clear responsibility
Before the project starts, name one officer who owns the measurement plan. That person should make sure the council collects the right data, brings it together and reports it properly. Having one point of contact and accountability is important for focusing the outreach accordingly.
Bring online and offline data together
Your participation platform may automatically record survey responses and website activity, whereas street interviews, neighbourhood meetings and paper forms usually require manual entry.
Collate all this information into one dataset so you gain a full overview. Otherwise, your final report may overlook residents who took part offline and give councillors a distorted picture of participation and viewpoints.
Use the findings to improve your next project
Look for patterns in who participates and who does not. For example, one neighbourhood or age group may appear regularly while another is consistently missing.
Use this evidence to plan targeted outreach before the next consultation. Then measure whether the new approach improved participation. This creates a healthy environment for continuous improvement within your reporting.
Use AI carefully to speed up analysis
AI tools can help you group themes and summarise large volumes of written feedback much faster than manual analysis.
An officer must still check the results for errors, missing context and bias, though. Used with proper human review, AI can speed up the process of consultation, reporting and getting feedback to residents, making it easier to complete the participation reporting required under the Omgevingswet.
FAQ
What is a realistic participation rate for a Dutch municipality?
Rates vary significantly by municipality size, project type and outreach method. Roughly 10% is considered high in the Netherlands, but a more useful benchmark is how representative the responses were related to the demographic of the area rather than raw volume.
What specific data must a participatieparagraaf contain under the Omgevingswet?
It must demonstrate how residents, businesses and civil society organisations were involved, which engagement methods were used and what the results were. This should include what changed and what did not.
How do we measure engagement with hard-to-reach groups?
Compare your participation demographic profile against government records for your municipality. If there is any consistent underrepresentation, you should take measures to close that gap. Targeted partnerships with local organisations, sending out translated materials and holding in-person events in those areas are examples of effective correction methods, depending on the nature of the underrepresented groups.
How does polarisation affect what we measure and report to the municipal council?
Polarised responses can make high-volume input misleading. Measuring representativeness alongside volume and flagging when responses come disproportionately from one group gives the municipality a more accurate picture of the broad sentiment in the community.
Conclusion
When it comes to how to measure community engagement, it is essential to understand what success looks like before you encourage participation. Decide on the KPIs you will monitor and design an engagement strategy that helps you reach a representative proportion of your electorate in a manner that makes them feel heard and valued. Be open and honest about what you did with their input and how it made a tangible difference to outcomes or explain why you took the project in a different direction.
Improve transparency with iBabs
From live streaming your council meetings with iBabs Stream to publishing decisions in an easy-to-use portal with iBabs Publish, our comprehensive governance platform helps you involve citizens in your decision-making processes, build trust and improve compliance. Learn more.

